Versatile Logging Software Works the Way you Want to Work
Windmill Logger records analogue and digital data from a vast range of sensors and instruments. The one thing they all have in common is that they can all be connected to a computer running Windows. You might connect them directly, or you might use a data acquisition interface between the sensor and computer.
We've designed Logger to be flexible, so it can work the way you want to work.

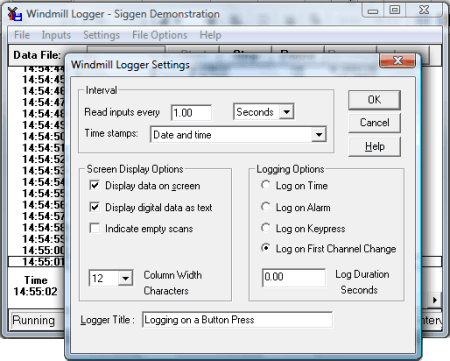
Setting some of the Logging Options
Choose how to start Logging
You can choose how and when to start logging data. For instance, you can
- Start logging when you press a key on the keyboard.
- Start logging when you click a button in the Logger software.
- Start logging when you start up the computer.
- Log only when new data is available from your instrument: when a weight changes on a balance for instance. Even if two items weigh the same, Windmill knows that a change has occurred and doesn't miss a reading.
- Log data only when a channel is in an alarm state, for example when a temperature reading rises above a set point then Logger will start collecting readings.
- Use other programs, like Excel, to tell Logger to start collecting data.
Save to a series of files
For continuous logging applications, you can choose to periodically close the logged file and open a new one every hour, day or week.
Choose how to stop Logging
You can also choose how and when to stop logging. Logger can
- Stop logging when you click the Logger Stop button.
- Log data for a fixed duration, for example during an alarm condition and for ten minutes afterwards.
Connecting more than 100 channels
Each Logger window records data from up to 100 analogue and digital channels. To log from more channels simply open another Logger window. You can log from many different instruments into one file, or you can log from various equipment independently - with results from different test rigs being logged to different files at different rates.
Log data up to 200 times a second
You can vary the sampling rate from less than once per hour up to 200 samples per second. Each set of samples is time stamped: choose from time of day, seconds and hundredths since start, date and time and so on. For long term logging, Logger will create a separate file for each hour, each day or each week. If required Logger can overwrite old data to continue logging indefinitely.
What can I use to Open the Logged Data File
You can use any program that can open ASCII text files, including Excel, Calc and Access.
The values can be separated by tabs (tsv), commas (csv) or spaces. The first column contains the time, date, or time and date of the data reading. Subsequent columns contain the data values.
The logged data file will look similar to this
Windmill Logger
File opened at 18:23:39 Tue 20 Mar 2023
File closed at 18:23:45 Tue 20 Mar 2023

Time        InputA     Channel2
Secs        volts      volts
18:23:39    1.21869    10
18:23:40    2.41922    10
18:23:41    3.58368    10
18:23:42    4.69471    -10
18:23:43    5.73576    -10
18:23:44    6.6913     -10
You can also send data in real time to other programs like Excel or Calc.
Setting Alarm Thresholds
With Windmill you can set warning and critical alarms on each channel of data. Should you only be interested in saving data when alarm levels are crossed, you can tell Windmill to start logging only on alarm. You can also set the duration of logging. Say a temperature reading rose above a set point for 5 minutes. Windmill would log data throughout this time. When the temperature returned to normal, Windmill would continue logging for your chosen duration. It would then stop until another alarm occurred.

Setting alarm levels
Use the SetupIML program to set alarm levels.

The Windmill Logger and Chart programs
Logger shows critical alarms with a red background and warning alarms with a blue background