-------------------------Monitor------------------------
The Newsletter for PC-Based Data Acquisition and Control
Issue 185         www.windmill.co.uk       December 2013
--------------------ISSN 1472-0221----------------------
Happy New Year - we which you a peaceful and prosperous one.
You can download a pdf version of this newsletter.
We hope you find Monitor useful, but should you wish to remove yourself from our mailing list you can do so at Monitor Newsletter
Contents
* Versatile Logging Software Works the Way you Want to Work
* Questions on Using Windmill: Mapping Software
* DAQ News Round-up
Versatile Logging Software Works the Way you Want to Work
Weblink: https://www.windmill.co.uk/logger.htmlWindmill Logger records analogue and digital data from a vast range of sensors and instruments. The one thing they all have in common is that they can all be connected to a computer running Windows. You might connect them directly, or you might use a data acquisition interface between the sensor and computer.
We've designed Logger to be flexible, so it can work the way you want to work. You can download a trial of Logger from https://www.windmill.co.uk/jsarrpsrr.htm

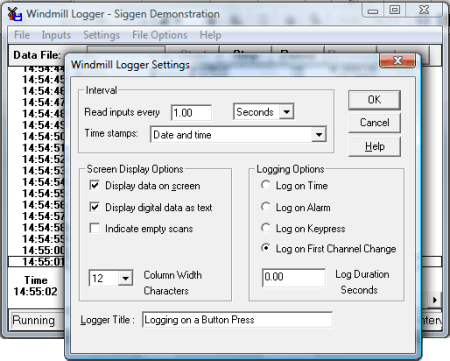
Setting some of the Logging Options
Choose how to start Logging
You can choose how and when to start logging data. For instance, you can
- Start logging when you press a key on the keyboard.
- Start logging when you click a button in the Logger software.
- Start logging when you start up the computer.
- Log only when new data is available from your instrument: when a weight changes on a balance for instance. Even if two items weigh the same, Windmill knows that a change has occurred, so no readings are missed.
- Log data only when a channel is in an alarm state, for example when a temperature reading rises above a set point then Logger will start collecting readings.
- Use other programs, like Excel, to tell Logger to start collecting data.
Choose how to stop Logging
You can also choose how and when to stop logging. Logger can
- Stop logging when you click the Logger Stop button.
- Log data for a fixed duration.
- Log data depending on conditions. For example, log data when an alarm occurs and for ten minutes after the alarm ceases.
How many Instruments and Data Channels can Logger Handle?
Each Logger window records data from up to 100 analogue and digital channels. To log from more channels simply open another Logger window. You can log from many different instruments into one file, or you can log from various equipment independently - with results from different test rigs being logged to different files at different rates.
Log data up to 200 times a second
You can vary the sampling rate from less than once per hour up to 200 samples per second. Each set of samples is time stamped: choose from time of day, seconds and hundredths since start, date and time and so on. For long term logging, Logger will create a separate file for each hour, each day or each week. If required Logger can overwrite old data to continue logging indefinitely.
What can I use to Open the Logged Data File?
You can use any program that can open ASCII text files.
The logged data file will look like this
Windmill Logger
File opened at 18:23:39 Mon 30 Dec 2013
File closed at 18:23:45 Mon 30 Dec 2013

Time        InputA     Channel2
Secs        volts      volts
18:23:39    1.21869    10
18:23:40    2.41922    10
18:23:41    3.58368    10
18:23:42    4.69471    -10
18:23:43    5.73576    -10
18:23:44    6.6913     -10
The values can be separated by tabs (tsv), commas (csv) or spaces.
You can also send data in real time to other programs like Excel.
Setting Alarm Thresholds
With Windmill you can set warning and critical alarms on each channel of data. Should you only be interested in saving data when alarm levels are crossed, you can tell Windmill to start logging only on alarm. You can also set the duration of logging. Say a temperature reading rose above a set point for 5 minutes. Windmill would log data throughout this time. When the temperature returned to normal, Windmill would continue logging for your chosen duration. It would then stop until another alarm occurred.

Setting alarm levels
Download a Free Trial or send for More Information
You can download a free trial of Logger, and the other Windmill programs. The trial works with devices communicating over RS232, RS485, Modbus and TCP/IP. Logger also works with the Microlink series of data acquisition hardware. For more information please get in touch.

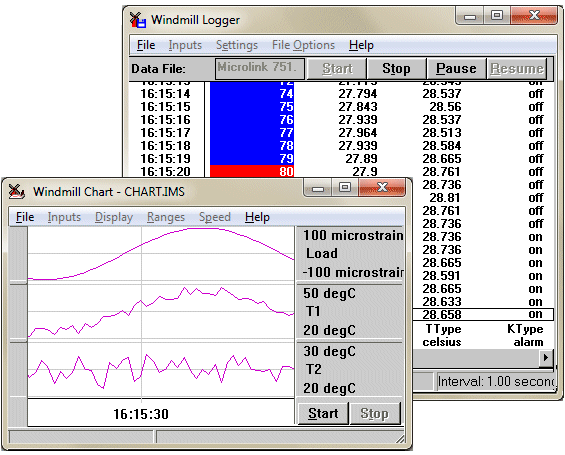
The Windmill Logger and Chart programs
Logger shows critical alarms with a red background and warning alarms with a blue background
Download free trial...
Logger, and the other Windmill programs, are currently on special offer from the Windmill catalogue for just £50.
Questions on Using Windmill
Question:
Your Web page 'Guide to Automatic Sea floor mapping' (https://www.windmill.co.uk/seafloormapping.html) mentions Surfer by Golden Software. This appears to cost $699. Do you know of any software that will turn the output of your Logger with depth, longitude and latitude channels into a simple 2D depth contour map and costs less than Surfer. I do not need 3D renditions or fancy colours
Answer:
3DField offers a free trial of mapping software. It then costs 99 USD after the trial has expired. The trial is available from: http://3dfmaps.com/
DAQ News Round-up
Welcome to our round-up of the data acquisition and control news. If you would like to receive more timely DAQ news updates then follow us on Twitter - @DataAcquisition or Google+ - https://plus.google.com/107072683025496630222/
Using moving cars to measure rainfall
Drivers on a rainy day regulate the speed of their windshield wipers according to rain intensity: faster in heavy rain and slower in light rain. This simple observation has inspired researchers to come up with 'RainCars', an initiative that aims to use GPS-equipped moving cars as devices to measure rainfall. Conventional rain gauges are accurate, but are often distributed too sparsely to capture much of this variation. Having good information about precipitation is important for flood prediction and prevention, for example.
Source: European Geosciences Union
http://www.egu.eu/
Chip is Power-Efficient by Fudging the Figures
Chips that reduce energy use by approximating some calculations could allow mobile devices to be smarter at understanding the world.
Source: MIT Technology Review
http://www.technologyreview.com/
Sensing unit helps drivers avoid bikes by using audio alert
A 'Cycle Eye' unit fitted to the outside of a bus uses radar and camera sensors to identify whether an object alongside the vehicle is a cyclist and gives the driver an audio alert, typically 'cyclist left'. The device was involved in a trial by Transport for London and over 3 days of testing had a 98.5 percent success rate at identifying cyclists.
Source: BBC
http://www.bbc.co.uk/
Colored Plastic Doubles Solar Cell Power
A thin sheet of dyed plastic could cut the cost of solar power, particularly for applications that require solar cells to be highly efficient and flexible.
Source: MIT Technology Review
http://www.technologyreview.com/
________________________________________________________
________________________________________________________

* Copyright Windmill Software Ltd
* Reprinting persmitted with this notice included
* For more articles see https://www.windmill.co.uk

We are happy for you to copy and distribute this
newsletter, and use extracts from it on your own web site
or publication, providing the above notice is
included and a link back to our website is in place.

An archive of previous issues is at
https://www.windmill.co.uk/newsletter.html
and an index of articles at
https://www.windmill.co.uk/monitorindex.html

Windmill Software Ltd, PO Box 58, North District Office,
Manchester, M8 8QR, UK
Telephone: +44 (0)161 834 6688
Facsimile: +44 (0)161 833 2190
E-mail: monitor@windmillsoft.com

https://www.windmill.co.uk/

https://www.windmillsoft.com/
Subscribing
To receive Monitor every month please fill in your e-mail address below. We will not pass your address to any third parties, nor send you any unsolicited e-mail.
