Monitor - ISSN 1472-0221
The Newsletter for PC-Based Data Acquisition and Control
Issue 223, March 2017
Welcome to Monitor, the data acquisition and control newsletter. Thanks for subscribing. Don't forget that you can download our data logging and troubleshooting software, ComDebug, from https://www.windmill.co.uk/serial.html.
You can download this issue of Monitor as a pdf file from https://www.windmill.co.uk/monitor/monitor223.pdf.
Contents
* Your Data Acquisition Questions Answered
* Excel Corner: Average, Maximum and Minimum chart lines
* Data Acquisition News Round-up
Your Data Acquisition Questions Answered: How Can I download just the ComDebug software?
Weblink: https://www.windmill.co.uk/serial.html
Question
I deleted my free trial by mistake and now can't re-install it. Is there a way to just install the ComDebug program? That's all I want to try.
Answer
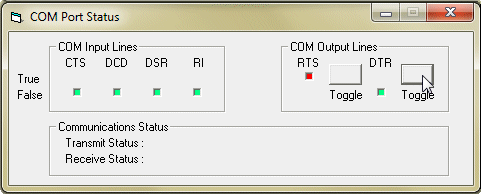
ComDebug, the data logging and COM port trouble-shooting software costs our subscribers nothing and never expires. It works with devices which communicate over RS232, RS422, RS485, Modbus and TCP/IP. You can download a copy of ComDebug on its own from https://www.windmill.co.uk/serial.html

For more information on ComDebug see https://www.windmill.co.uk/serial.html. Any questions or comments email monitor@windmillsoft.com.
"Your software works great; it's the only package that allows me to set the DTR line low...required by the TI (Texas Instruments) development board configuration."
"Really useful tool. We have been using it to get familiar with quite a huge set of devices."
"Outstanding little tool! Best freebie I've ever seen!"
Excel Corner: Adding average, maximum and minimum levels to your Excel chart
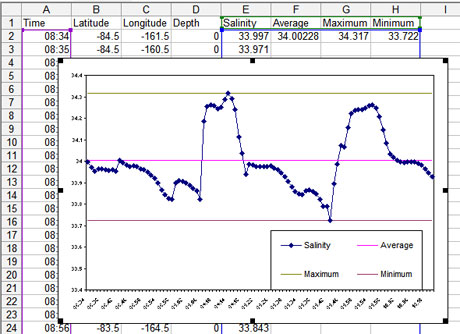
A reader this month wanted to know how to add average, maximum and minimum horizontal lines to his Excel chart.

- In the headings row of your spreadsheet type Average, Maximum and Minimum into the three columns to the right of the data.
- In the first data row, use =Average, =Max and =Min to calculate the average, maximum and minimum values for the data.
- Scroll down to the last data row and do the same.
- Draw your line chart as normal.
- Make sure Excel interpolates the empty cells - drawing a line between points. For older versions of Excel, from the Tools menu select Options and Chart and choose to plot empty cells as interpolated. For later versions right click the chart, choose Select Data then "Connect Data Points with Line" in the Hidden and Empty Cells setting.
For more Excel charting tips see https://www.windmill.co.uk/excel/
DAQ News Round-up
Welcome to our round-up of the data acquisition and control news. If you would like to receive more timely DAQ news updates then follow us on Twitter - @DataAcquisition - or grab our rss feed.
Sonic cyber attack shows security holes in accelerometer sensors
Sound waves could be used to hack into critical sensors in a broad array of technologies including automobiles, medical devices and the Internet of Things. The new work calls into question the longstanding computer science tenet that software can automatically trust hardware sensors, which feed autonomous systems with fundamental data they need to make decisions.
Source: University of Michigan
http://ns.umich.edu/
Rampaging IoT Global Market to Gain $37 Billion by 2021
Sensors are often the critical end point or starting point for IoT communications. Emerging technology shaped by new requirements for IoT applications will create new product categories or revitalise existing products through adaptations, says BCC Research.
Source: bcc research
https://www.bccresearch.com/
First tests on fuel-cell powered passenger train
Alstom have successfully performed the first test run at 80 km/h of the world's only fuel cell passenger train. The zero-emission train is silent and only emits steam and condensed water.
Source: Alstom
http://www.alstom.com/
Flexible sensor detects different types of touch
Researchers have developed a bendable, stretchable, transparent sensor that could have a wide range of applications in wearable electronics.
Source: University of British Columbia
http://news.ubc.ca/
Quantum Computers May Have Higher Speed Limits Than Thought
How fast will a quantum computer be able to calculate? While fully functional versions of these long-sought technological marvels have yet to be built, one theorist at the National Institute of Standards and Technology has shown that, if they can be realised, there may be fewer limits to their speed than previously put forth.
Source: NIST
https://www.nist.gov/
* Copyright Windmill Software Ltd
* Reprinting permitted with this notice included
* For more articles see https://www.windmill.co.uk/
We are happy for you to copy and distribute this
newsletter, and use extracts from it on your own web
site or other publication, providing the above notice
is included and a link back to our website is in place.
For previous issues by subject see https://www.windmill.co.uk/monitorindex.html
DOWNLOAD DATA ACQUISITION SOFTWARE
As a thank you for subscribing we offer you the ComDebug data logging and Com port trouble-shooting software. Log data over RS232, RS422, RS485 or Modbus. Also included is a month's trial of the Windmill 7 logging, charting and control programs.
SUBSCRIBING OR CANCELLING SUBSCRIPTION Visit https://www.windmill.co.uk/newsletter.html and add or remove your e-mail address.
Windmill Software Ltd, PO Box 58, North District Office,
Manchester, M8 8QR, UK
Telephone: +44 (0)161 834 6688
Facsimile: +44 (0)161 833 2190
E-mail: monitor@windmillsoft.com
https://www.windmill.co.uk/
https://www.windmillsoft.com/
