Monitor - ISSN 1472-0221
The Newsletter for Data Acquisition and Control
Issue 306 October 2024
Welcome to Monitor: thank you very much for subscribing. This month, a conversation about our data logging unit for remote monitoring and control, and how to use Excel as a data logger.
You can download Monitor as a pdf file from https://www.windmill.co.uk/monitor/monitor306.pdf.
Contents
* Listen to the conversation on remote data logging
* Your DAQ Questions Answered: How to use Excel as a data logger
Listen to the conversation on remote data logging
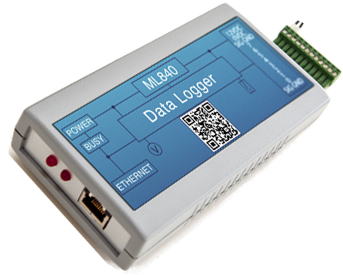
The Microlink 840 multi-purpose data logger now connects to the Internet-of-Things, WiFi, MQTT and Ethernet networks. Listen to a conversation about what it can do at https://www.windmill.co.uk/ML840.wav
This eight-channel, battery-backed, data logger lets you:
- Acquire remote data in real-time
- Monitor analogue signals including pressure, temperature, force, voltage and current
- Monitor digital sensors like flow meters
- Monitor digital status, eg count switch closures
- Monitor machines, eg record percentage on/off times
- Count: accumulating, frequency, period, pulse width and elapsed time
- Monitor energy use
- Monitor alarm thresholds and output digital control signals
- Communicate via MQTT, TCP/IP, Ethernet, Internet and WiFi
- Suitable for mass remote energy monitoring, level detection and status logging making it an incredibly versatile tool.
- Use outside with weatherproof option
- Receive free technical support for life

Logging Data
You can choose the time period over which to store data, every minute or every hour say. For each channel you can save:
- Final value of the logging period, eg total energy used
- Maximum value
- Minimum value
- Average value
- Custom calculations on the data

Microlink 840 Specifications
| Max inputs & outputs | 8 |
| Logging epoch | 1 minute to 9 hours |
| Logged values | Maximum, minimum, average and final value of epoch + custom calculations on data |
| Counting options | Accumulating, frequency, period, pulse width, elapsed time |
| Maximum | Over 16 million |
| On & off time before a count is logged | Selectable from 1 to 255 millisecs |
| Count resolution | 16- or 32-bit |
| Analogue input range | 0-3.3 V. Can be made 0-5, 0-10 V or bipolar |
| Communications | MQTT, TCP/IP, Wi-Fi, Internet, Ethernet |
| Data available in real-time | |
Find out more - contact sales@windmill.co.uk, see https://www.windmillsoft.com/daqshop/ethernet_logger.html, listen to the conversation or downoad the leaflet.
Your DAQ questions answered: Turning Excel into a Data Logger
Question
"I am looking to use the Windmill SW to log data in Excel. Is this software still available and how do I get it?"
Answer
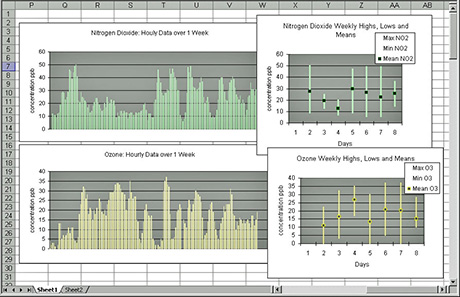
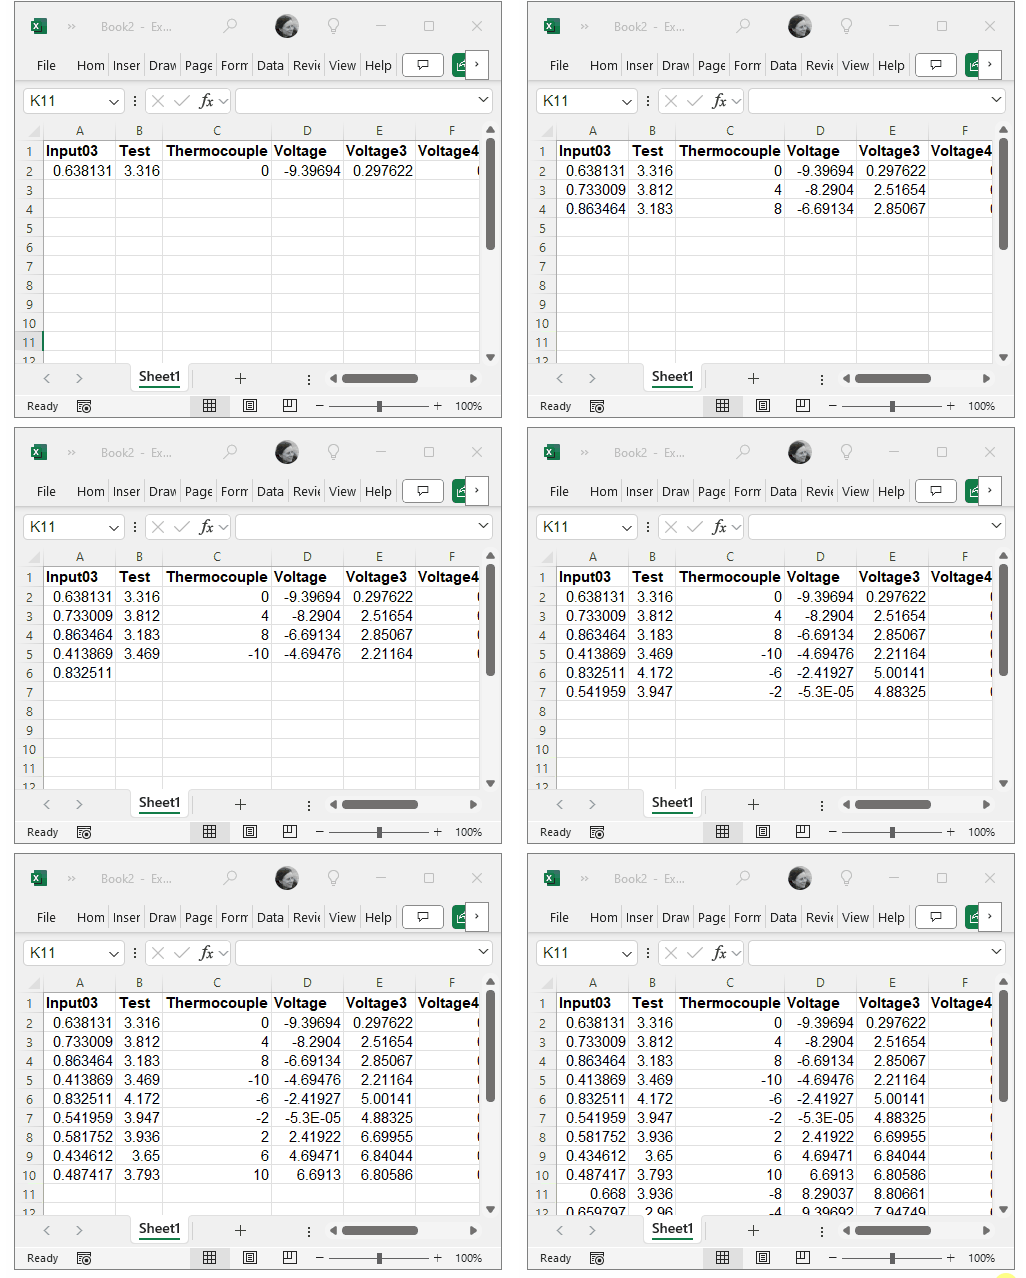
It's easy to turn Excel into a data logger with the Windmill DDE Panel software and a simple macro. You can see examples on our website, including to repeatedly samples data from all your RS232, RS485 and Modbus instruments' channels.

Here an Excel macro is used to log data via Windmill DDE Panel and the example software signal generator values
And to get it? Just email monitor@windmillsoft.com for your free copy.
For many more tips on using Excel for data logging, see https://www.windmill.co.uk/excel/excel-tips.html. Any questions? Email monitor@windmillsoft.com.